
Amazon PPC Reporting Metrics: CTR, CPC, ACOS, ROAS, TACOS Explained
Amazon PPC can feel overwhelming when you first open a campaign dashboard.
Numbers are everywhere.
Clicks. Impressions. CTR. CPC. ACOS. ROAS. TACOS.
Many sellers spend months looking at these metrics without fully understanding what they are actually measuring or how they relate to one another. The result is usually the same: campaign changes based on guesswork instead of data.
The good news is that most Amazon PPC reporting comes down to a few core metrics. Once you understand what each one tells you, campaign decisions become much easier.
Why PPC Metrics Matter
Advertising metrics are not just numbers on a dashboard. Each one tells part of the story.
Some metrics tell you whether shoppers are seeing your ads. Some show whether those shoppers are clicking. Others reveal whether the advertising is producing sales at a cost your business can actually support.
The challenge is that no single metric tells the entire story.
A low ACOS can be good. It can also mean your ads are barely reaching anyone. A high CTR can be good. It can also mean your ad is attracting clicks from the wrong shoppers.
Context matters.
This is why strong Amazon sellers evaluate metrics together instead of treating one number as the final answer.
The Five Core PPC Metrics Every Seller Should Understand
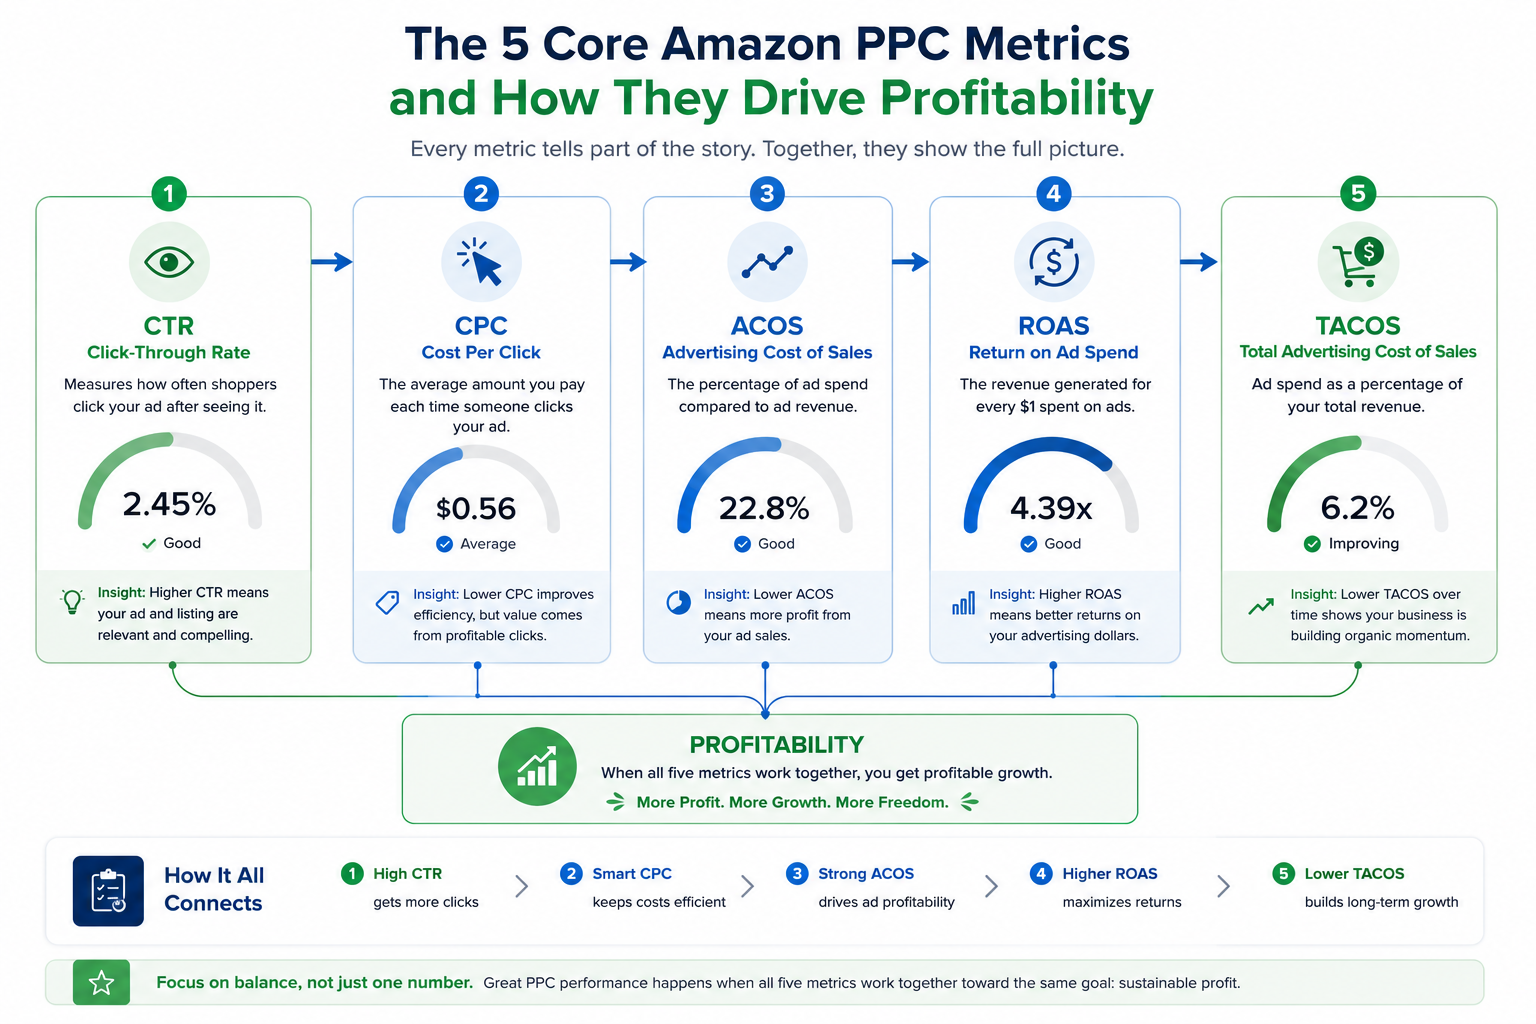
Most PPC reporting can be understood through five metrics:
- CTR, or click-through rate
- CPC, or cost per click
- ACOS, or advertising cost of sales
- ROAS, or return on ad spend
- TACOS, or total advertising cost of sales
Think of them as different gauges on the same machine.
CTR tells you if people are interested enough to click. CPC tells you how expensive that traffic is. ACOS and ROAS tell you how efficiently ads are turning spend into sales. TACOS tells you how advertising affects the larger business.
This article assumes you already understand the basic structure of Amazon ads. If not, start with Amazon PPC Campaign Types Explained or Amazon PPC for Beginners.
CTR: Click-Through Rate
CTR measures how often shoppers click your ad after seeing it.
Formula: CTR = Clicks ÷ Impressions
For example, if your ad receives 10,000 impressions and 250 clicks, your CTR is 2.5%.
A higher CTR generally means your product looks relevant to the shopper. Your image may be strong, your title may match the search, your price may look reasonable, or your product may simply be a good fit for the keyword.
A low CTR often signals a visibility problem before it signals a bidding problem.
Before increasing bids, ask a simple question: would someone actually want to click this listing?
If the main image is weak, the price looks high, or the product title does not match the search intent, more ad spend will not fix the core issue.
Related Topics
CPC: Cost Per Click
CPC measures how much you pay each time someone clicks your ad.
Formula: CPC = Ad Spend ÷ Clicks
If you spend $150 and receive 300 clicks, your CPC is $0.50.
Higher CPCs usually show up in competitive categories or on keywords where multiple sellers are bidding aggressively. Lower CPCs often appear on long-tail keywords, less competitive search terms, or highly specific product searches.
Many sellers focus heavily on lowering CPC. That can be useful, but low CPC is not automatically good.
A $2 click can be profitable if the keyword converts well and the product has enough margin. A $0.20 click can still waste money if nobody buys.
Traffic cost only matters when viewed beside conversion, revenue, and profit.
ACOS: Advertising Cost of Sales
ACOS is one of the most common Amazon PPC metrics.
It tells you how much advertising spend was required to generate advertising revenue.
Formula: ACOS = Ad Spend ÷ Ad Revenue
If you spend $200 on ads and generate $1,000 in ad sales, your ACOS is 20%.
That means you spent $0.20 in advertising for every dollar generated through ads.
Lower ACOS is usually better, but only when it is evaluated against your margin. A 25% ACOS might be healthy for one product and unprofitable for another.
A product with strong margins can tolerate more advertising pressure. A product with thin margins has less room for error.
Related Topics
ROAS: Return on Ad Spend
ROAS is the inverse of ACOS.
Instead of showing how much ad spend was required to generate sales, it shows how much revenue was generated for every advertising dollar spent.
Formula: ROAS = Revenue ÷ Ad Spend
If you spend $200 and generate $1,000 in sales, your ROAS is 5.0.
That means every $1 in advertising generated $5 in ad sales.
ACOS and ROAS are two ways of looking at the same relationship. Some sellers prefer ACOS because it shows cost. Others prefer ROAS because it shows return.
TACOS: Total Advertising Cost of Sales
TACOS compares advertising spend against total revenue, not just ad-generated revenue.
Formula: TACOS = Ad Spend ÷ Total Revenue
If you spend $500 on ads and generate $10,000 in total revenue, your TACOS is 5%.
This metric helps answer a bigger question: how dependent is the business on advertising?
That makes TACOS especially useful for evaluating long-term growth.
Many healthy Amazon businesses want to see TACOS decrease over time. That usually means advertising is helping build organic ranking, review velocity, and product visibility. As organic sales grow, ad spend becomes a smaller percentage of total revenue.
In other words, TACOS helps you see whether ads are creating momentum or just buying every sale one click at a time.
What Is TACOS and Why It Matters for Amazon PPC Profitability goes deeper into this concept, especially the relationship between PPC and organic growth.
[IMAGE: Line chart showing TACOS decreasing over time while total revenue increases. Visual analogy of advertising creating momentum, with organic sales growing as dependence on ads decreases. Clean Amazon analytics dashboard style.]
How These Metrics Work Together
The biggest mistake is looking at each metric in isolation.
Metrics are connected.
For example, high CTR and high CPC may mean shoppers are interested, but the traffic is expensive. High clicks and weak sales may point to a conversion issue. Low ACOS may seem attractive, but if the campaign barely spends, it may not be contributing much growth.
The goal is not to find one perfect number.
The goal is to understand what the combination of metrics is telling you.
PPC Metrics Diagnostic Table
Which PPC Metric Matters Most?
There is no single most important PPC metric.
Different metrics matter at different stages.
During launch, CTR and CPC may matter more because you are trying to understand whether shoppers respond to the offer and how expensive traffic is.
During optimization, ACOS and ROAS become more important because you are trying to improve efficiency.
For long-term growth, TACOS often becomes the most revealing metric because it shows whether the business is becoming less dependent on paid traffic over time.
This is why PPC reporting should match the stage of the product.
A Simple PPC Review Process
When reviewing a campaign, follow a consistent order.
Start with CTR. Are people clicking?
Then review CPC. Are clicks reasonably priced?
Next, look at ACOS and ROAS. Are ads generating sales efficiently?
Finally, review TACOS. Is advertising helping the overall business grow, or is it simply buying every sale?
That sequence prevents many common mistakes. It keeps sellers from lowering bids too early, pausing campaigns too soon, or scaling traffic that is not actually profitable.
Stop Looking at Metrics in Isolation
Amazon PPC metrics are most useful when they are viewed together.
CTR explains attention.
CPC explains traffic cost.
ACOS explains ad efficiency.
ROAS explains return.
TACOS explains business-level growth.
Once you understand how these metrics connect, campaign optimization becomes less emotional and more practical.
You stop guessing which campaigns are working.
You start reading the story the data is already telling you.
.png)