
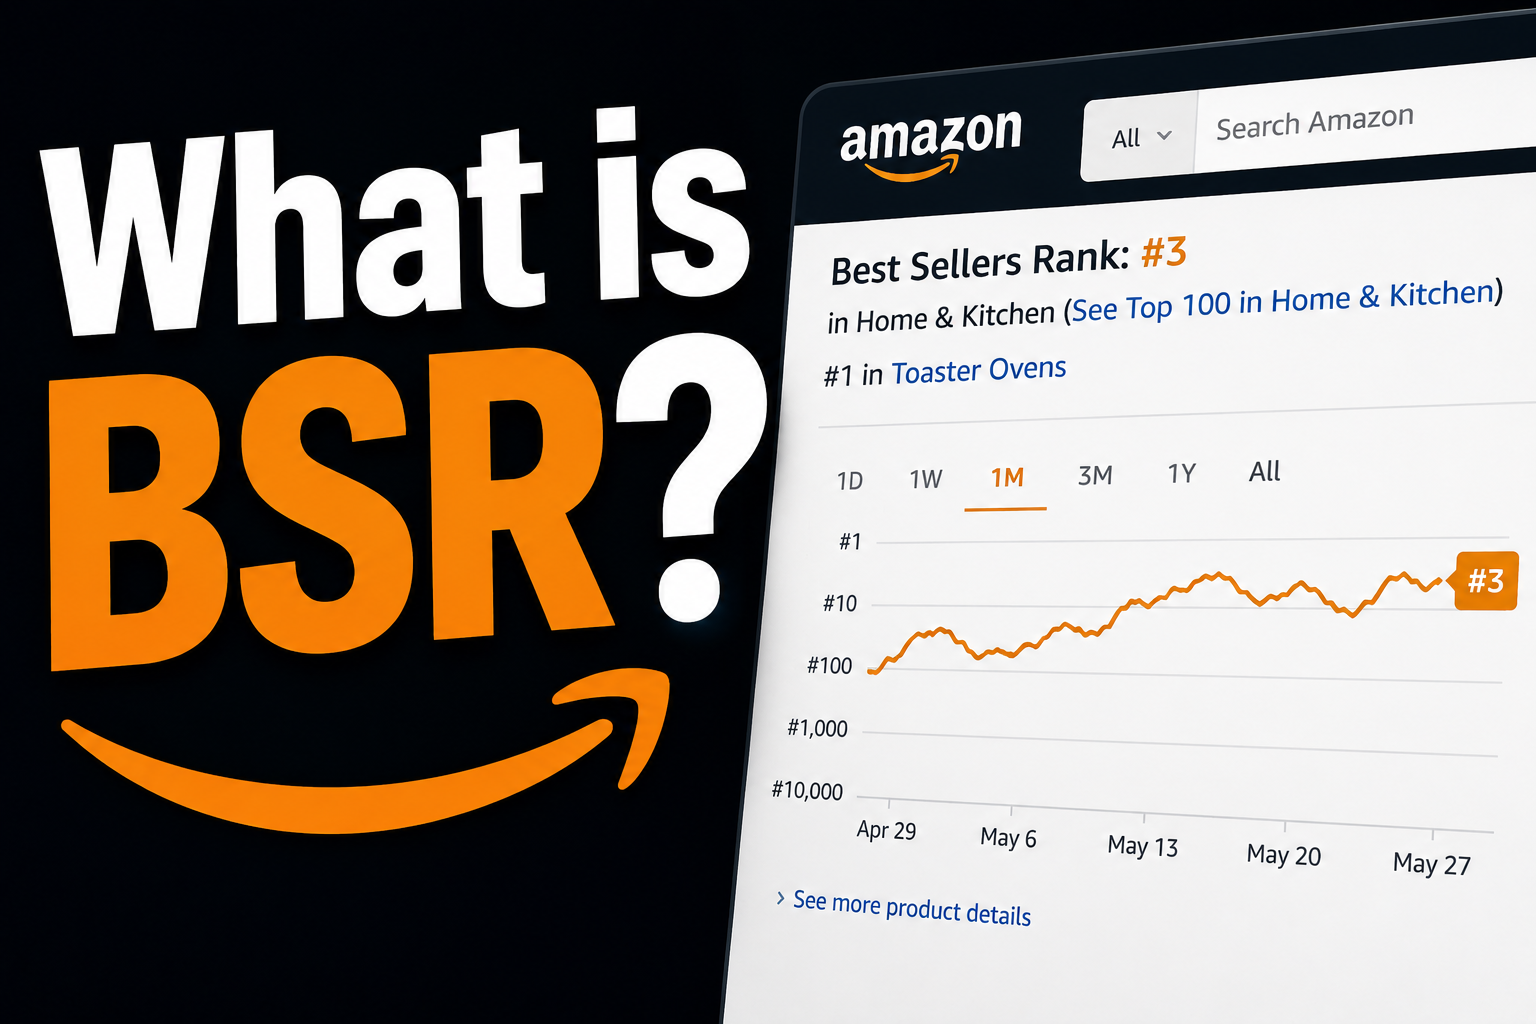
If you've spent any time researching products on Amazon, you've probably seen a number called BSR.
At first glance, it looks simple. Lower numbers seem better than higher numbers.
While that's technically true, many sellers misunderstand what BSR actually tells them.
Some assume it measures demand.
Others think it predicts profitability.
Neither is entirely correct.
BSR is one of the most useful signals available to Amazon sellers, but only when you understand what it does—and doesn't—tell you.
What Does BSR Mean?
BSR stands for Best Sellers Rank.
Amazon assigns a ranking to products within their category based primarily on recent sales performance.
A product ranked:
- #50 is selling more than a product ranked #500
- #500 is selling more than a product ranked #5,000
The lower the number, the stronger the recent sales activity.
A product with a BSR of 150 in its category is generally selling much faster than a product with a BSR of 15,000.
That part is straightforward.
The challenge comes when sellers try to use BSR as a shortcut for evaluating products.
What BSR Actually Tells You
BSR is best viewed as a demand signal.
It helps answer questions like:
- Is this product actively selling?
- Is demand relatively consistent?
- Is there meaningful customer interest?
A healthy BSR often indicates real movement in the market.
What it doesn't tell you is:
- profitability
- competition
- advertising costs
- margins
- inventory requirements
Those need separate analysis.
Why Product Researchers Love BSR
Imagine you're comparing two products.
Both look promising.
Both have decent reviews.
Both appear to fit your budget.
One product has maintained a BSR under 1,000 for months.
The other jumps between 3,000 and 40,000 every few weeks.
Even without knowing anything else, you already have useful information.
One product appears to have stable demand.
The other appears less predictable.
BSR helps reveal those patterns.
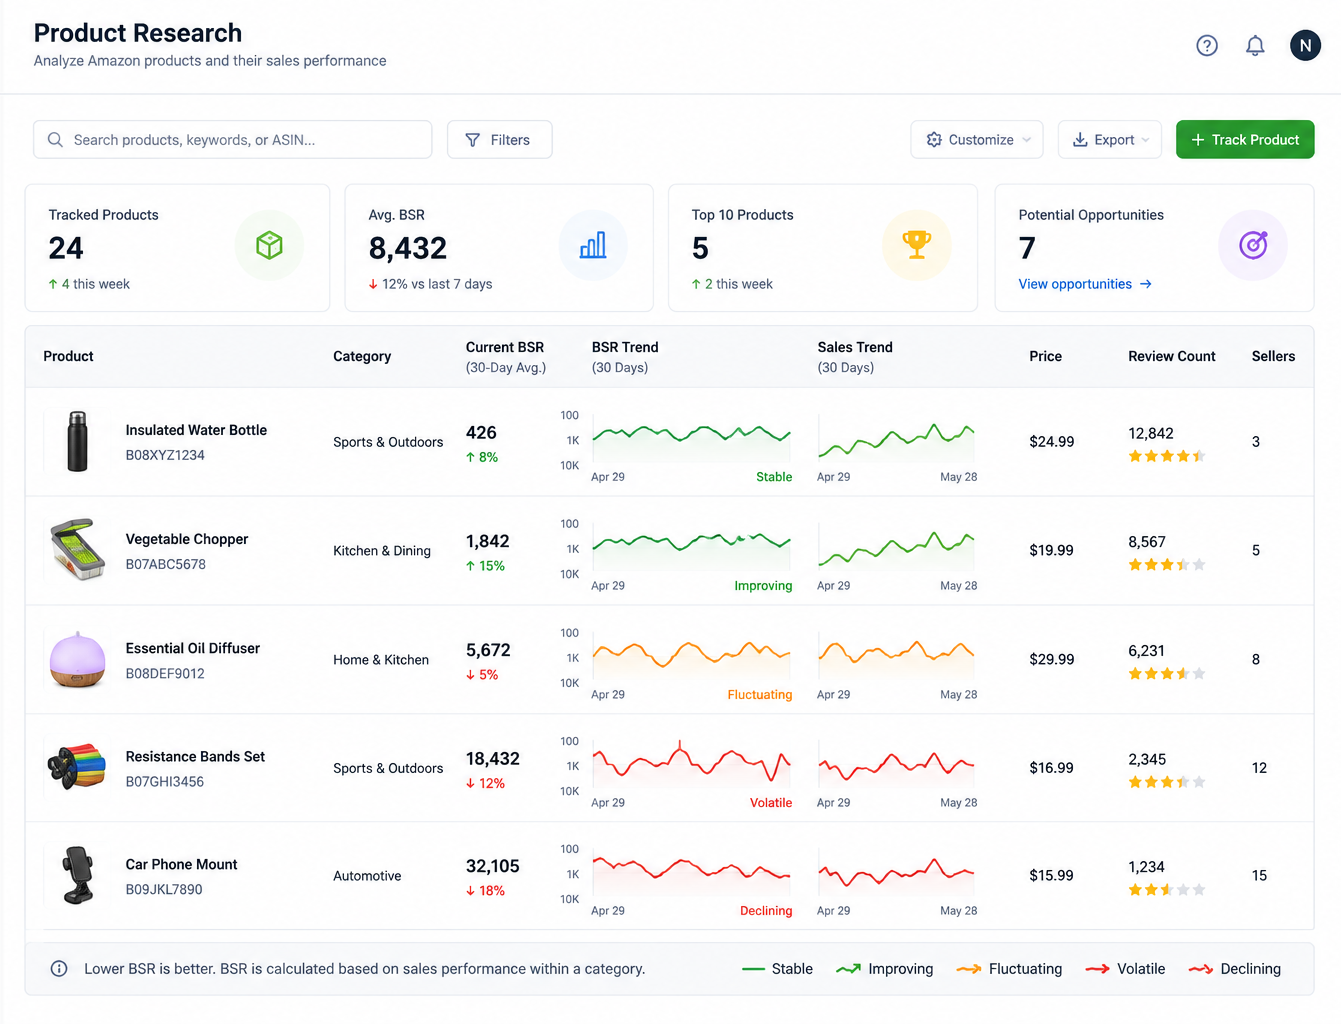
BSR Is More Useful as a Trend Than a Snapshot
One of the biggest mistakes sellers make is looking at a single BSR number.
A single number only tells you what's happening right now.
A trend tells you what's happening over time.
A product whose BSR remains stable month after month often has consistent demand.
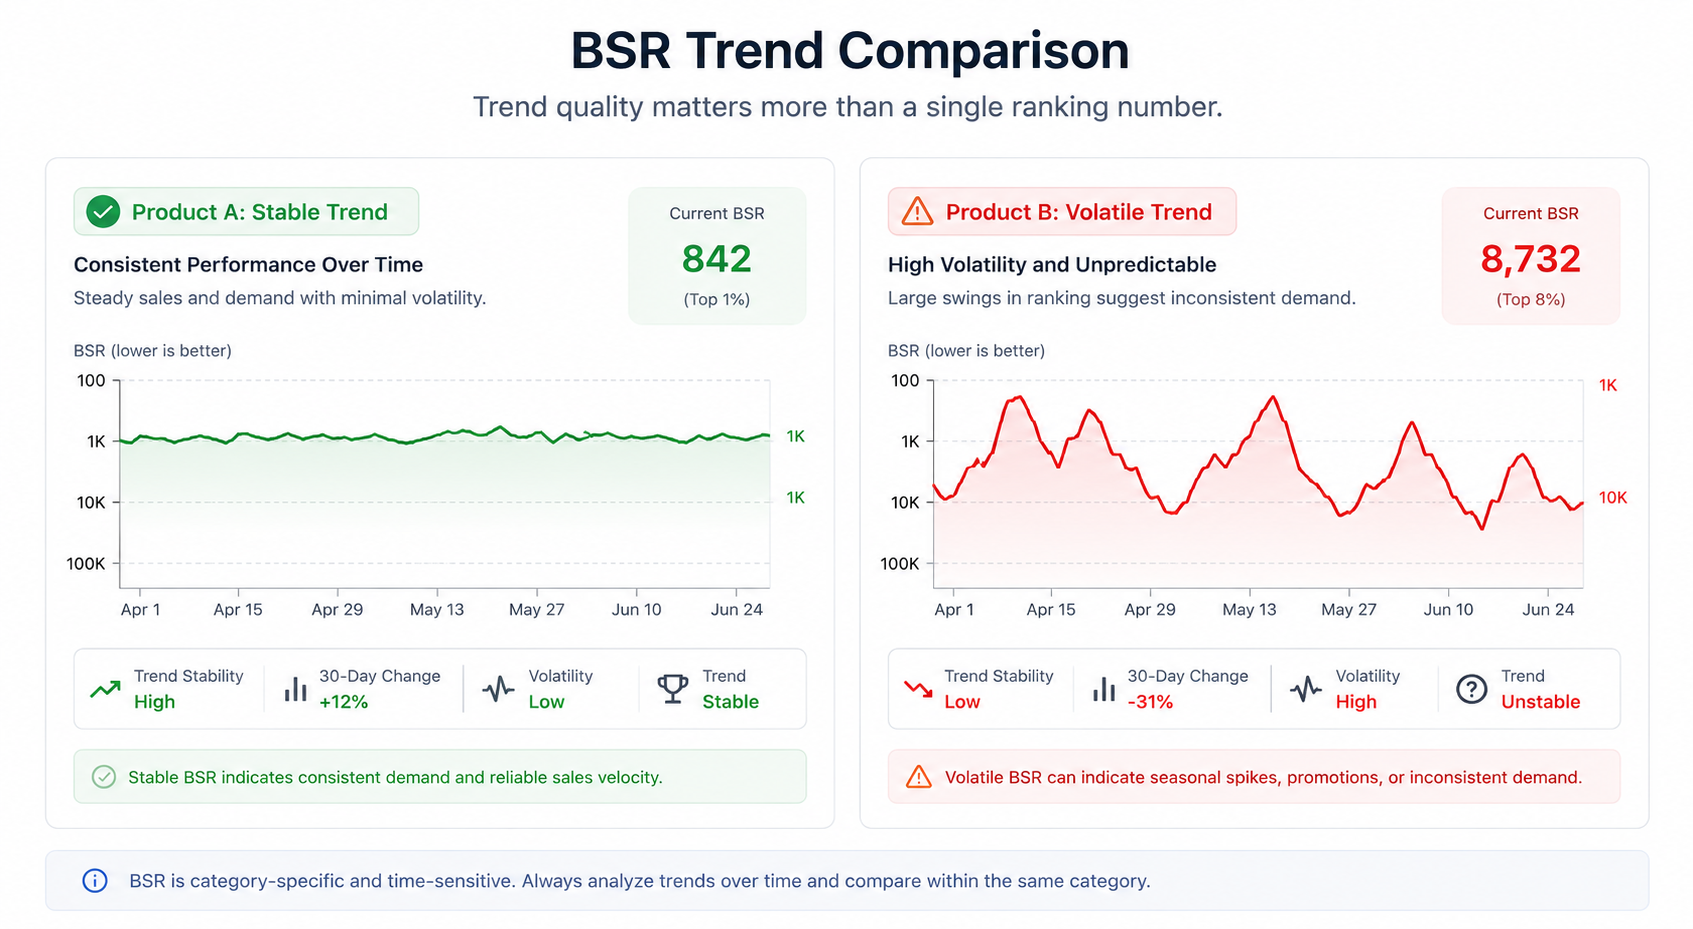
A product with massive swings may be:
- seasonal
- promotion-driven
- dependent on temporary traffic
This is why historical BSR tracking is often more valuable than the current rank itself.
Understanding Category Differences
BSR only matters relative to the category.
A BSR of 500 means something very different in:
- Home & Kitchen
- Sports & Outdoors
- Pet Supplies
Large categories have far more competition and volume.
Smaller categories may have dramatically fewer sales despite similar rankings.
Always compare products within the same category whenever possible.
BSR and Product Validation
BSR becomes especially useful before launching a product.
When evaluating opportunities, sellers often ask:
"Is there enough demand?"
BSR can help answer that question.
If multiple competing products maintain strong rankings over time, it suggests the market is active.
If rankings fluctuate wildly or remain consistently poor, demand may be weaker than it first appears.
BSR Doesn't Equal Profit
This is where many new sellers get burned.
A product can have:
- excellent BSR
- strong sales volume
- healthy demand
And still be a terrible business opportunity.
Why?
Because demand is only one piece of the equation.
You still need to consider:
- Amazon fees
- PPC costs
- competition
- pricing pressure
- inventory costs
A high-selling product isn't automatically a profitable one.
Quick BSR Interpretation Guide
Note: These ranges vary significantly by category and should be used only as rough guidelines.
How Nformed Uses BSR Data
BSR becomes most powerful when combined with other product research metrics.
Instead of looking at rank alone, you can evaluate:
- BSR trends
- pricing changes
- seller counts
- inventory movement
- demand signals
Together, these provide a much clearer picture than any individual metric can offer.
That's where product research shifts from guessing to validating.
Common BSR Mistakes
Some sellers dismiss products because the BSR isn't impressive enough.
Others chase low BSR products without evaluating competition.
Both approaches miss the bigger picture.
BSR should be used as one signal among many.
It helps identify opportunities, but it should never make decisions for you.
Use BSR as a Starting Point, Not a Conclusion
BSR is one of the fastest ways to understand whether products are moving on Amazon.
It's useful.
It's powerful.
But it's only part of the story.
The best product decisions happen when BSR is combined with demand validation, competition analysis, pricing research, and profitability forecasting.
That's how you move beyond simply finding products that sell and start finding products that make money.
.png)